Posts

Module # 13 Shiny Web App

Image
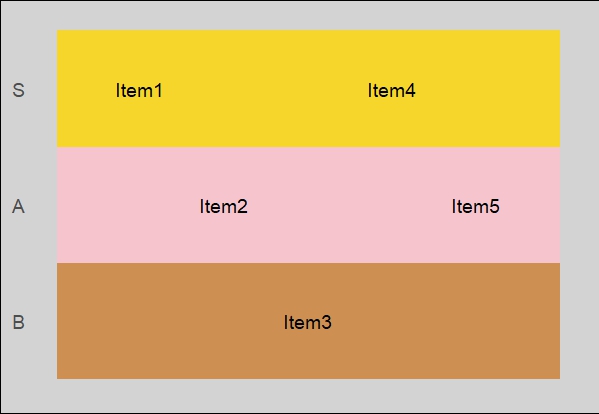
  Creating My Own Package in R via RStudio 1) This week I learn about Shiny, a product from R that allows us to create web applications in R itself. This is a very powerful tool that uses client-server communication, HTML, layout and JavaScript programming to make web applications. This however is not what we will be using today complete our assignment. This week I will be creating my own R package that will be available via my GitHub.  2) I will be creating an R package that will allow users to create their own tier list in RStudio. This will help visualize what variables or objects are more important than others in rank. Users will be able to (hopefully) rank variables or other information in their data to help explain how things are ranked on a arbitrary scale according to the audience in mind. Such as creating a tier list of books based off of how much they sold, their reviews, or what genres are better. It can use objectively to reorganize the audiences focus or used to s...

Module # 12 R Markdown

  R Markdown and the LaTeX Mathematical Typesetting Language 1) This week we are going to make a Markdown file in RStudio and then post that code on GitHub. I have decided to focus on a certain topic that helps me in another class about the same topic. Predicting passenger survival on board of the titanic.  2) We are now going to make our R Markdown file, and add some pieces to it rather than just leaving the default options on there. We are then going to look at it on both the source side and the visual side and the complied side. The following is the source side:

Module # 11 Debugging and defensive programming in R

  Seek and Destroy: A Deliberate Bug in R 1) This week I tackle debugging a piece of code in R. Up until now I have only had to really deal with my own bugs, but now I tackle someone else's. This is meant to be like a puzzle which I usually enjoy so lets see how this one goes.  2) The code I was given, and the error it is giving, is shown below:

Module # 10 Building my own R package

  Creating the Tier List Package in RStudio 1) This is now week ten of this course and I am now starting to see the end. This week I tackle creating my very own package in R. This is a very first for me and I am very excited. Based on the title of this blog you can tell that I plan to create a package that allows users to create a tier list in RStudio. This will all take a lot of work, much more than I can do in a single assignment, so the only goal for this week is to create the  DESCRIPTION file for the package. This tell us everything that the package is about and its purposes. Here it is down below:

Module # 9 Visualization in R

Image
  Three types of Visualization in R 1) Today we are going to be taking a look at a dataset about consumer goods with three different visualization methods in R. We will first see what we can do without any packages in R. Just the basics, to create some sort of graphic. Then we will be using lattice, and then finally ggplot2.  2) The data base we will be using for this assignment is called " Properties of a Fast-Moving Consumer Good" found here . Without further ado let's get to it. 3) BASE R VISUALIZATION

Module # 8 Input/Output, string manipulation and plyr package

  String Manipulation and the plyr Package 1) We have three important steps we need to cover for this week's assingent. Step #1: Import some data then, run the commend "mean" using Sex as the category (use plyr package for this operation). Last commend in this step: write the resulting output to a file. Step#2: Convert the data set to a dataframe for names whos' name contains the letter i, then create a new data set with those names, Write those names to a file separated by comma’s (CSV). Step#3: Write the filtered data set and convert it to CSV file. With all of that laid out lets write some code to make it all happen. 

Module # 7 R Object: S3 vs. S4 assignment

  Objects in R: S3 vs. S4 1) This week we have three steps to complete, as we learn about object oriented programing or OOP. First we need to find a data set. Then see if a generic function can be assigned to said data set. The last step is to see if S3 or S4 objects can be assigned to the data set. Here we go. 2) The data set I have chosen covers electric vehicle population. I chose this one because it was the easiest to obtain besides mtcars. You can find it here for free .  3) To see if a generic function can be assigned to this data set. To do this we need to first understand what a generic function is. A generic function in R, are functions designed to change their behavior based on the class of the input object. Some examples of this are "plot", "mean", "predict", "summary" etc. We are going to try to use "summary" on our data and see if we get back a summary of each column, custom made to that column's data type. Here we go: